
How to Build a Monthly Product Performance Report Using MagicBean
If you're looking to keep tabs on how well your products are performing each month, you really need to start putting together a product performance report. It's super helpful. Everything changes so fast, and knowing the score with your product sales can help you keep up, or even get ahead. These reports are like your monthly check-up; they show you what's working and what's not. By keeping track of all this stuff, you can make better choices, keep your customers happy, and maybe even increase your sales.
What is a Product Performance Report?
A product performance report is a document or dashboard that outlines key performance indicators (KPIs) related to a company's products. It’s a collection of data points like sales volume, revenue, and customer reviews that show you how your products are doing in the marketplace. Whether you’re trying to see how a new product is being received or figuring out which products are your all-stars, these reports can give you the insights you need.
How to Build a Monthly Product Performance Report Using MagicBean
MagicBean is your go-to AI tool for easily pulling together all the important stats you need about your products. Here’s a straightforward guide on how you can use MagicBean to stay updated on how your products are performing:
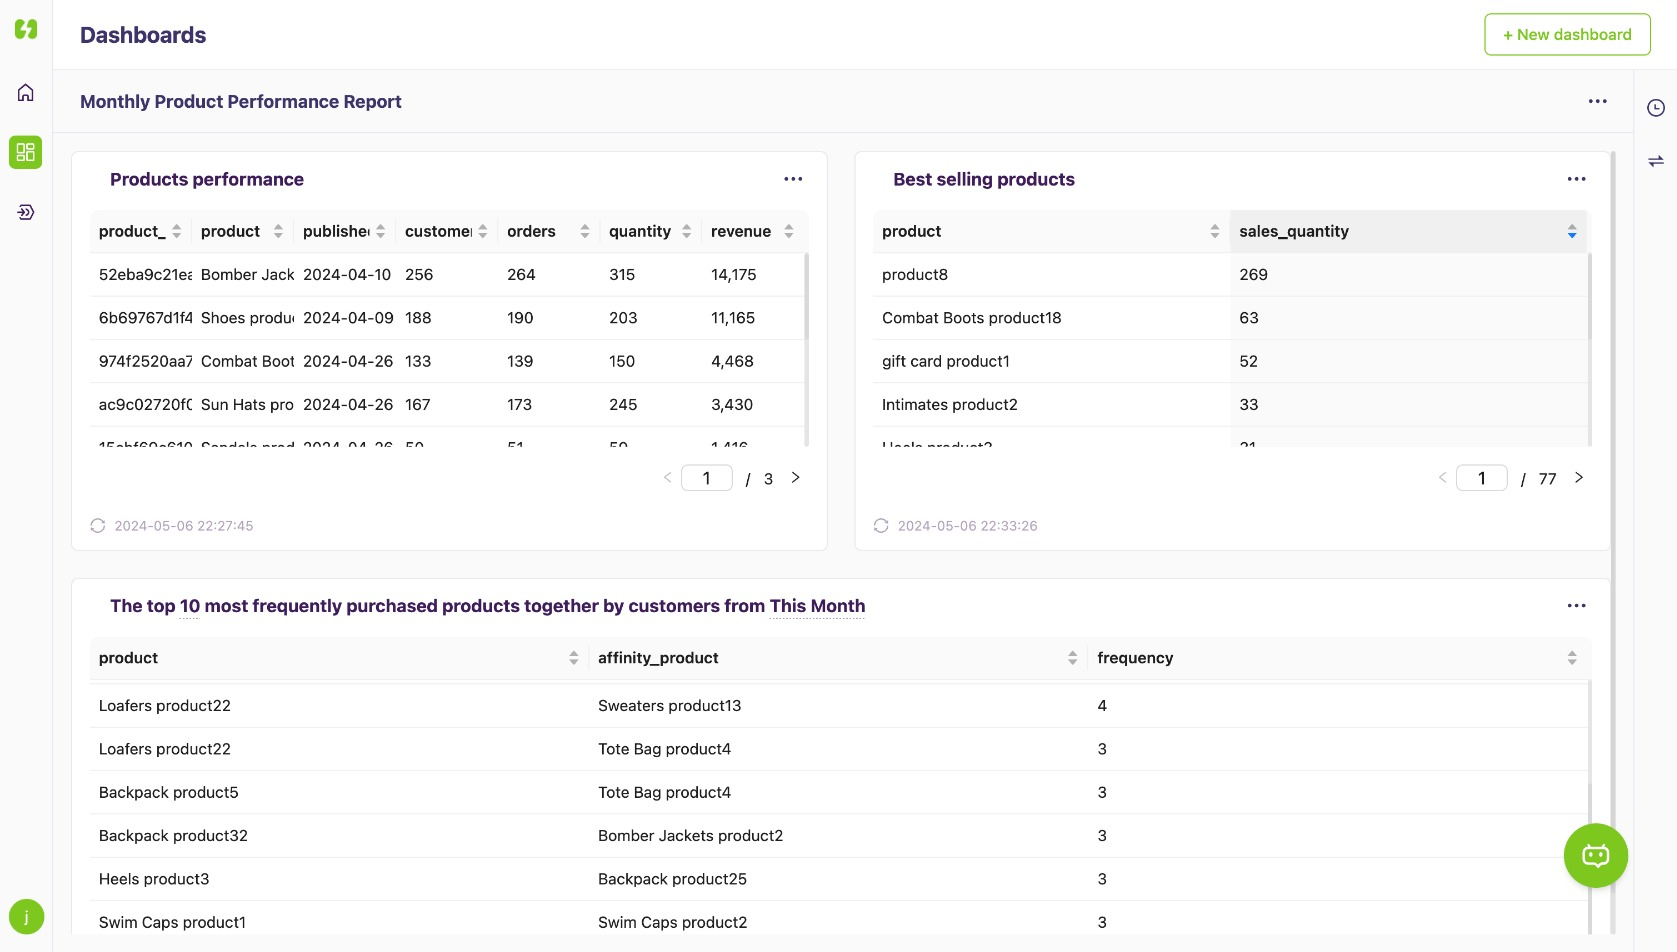
- Head to the Dashboard: Start by logging into MagicBean and navigating to the dashboard.
- Pick a Report: MagicBean offers a bunch of ready-to-use report templates. You can choose reports like "Performance of products released in the last 30 days," "The sales quantity of each product sold," or "The top 10 most frequently purchased products together by customers." for product performance report.
- Customize Your Data: Each report comes with customizable parameters. For instance, in the "Performance of products released in the last 30 days" report, you can tweak the number of days to fit your needs. This flexibility allows you to focus on the data that matters most to you.
- Analyze Your Results: Once you’ve set your parameters, hit the generate button and get your results in seconds. MagicBean also offers tools for visualizing your data, so you can see everything in easy-to-understand charts and graphs.
How to Improve Product Performance
Boosting your product performance isn’t just about collecting data—it’s what you do with it that counts. Here are some actionable tips:
- Dig into the Data: Use your monthly reports to spot trends and areas for improvement. Are there certain times when sales spike? What’s not selling?
- Listen to Your Customers: Customer feedback is like gold dust. It tells you what’s working and what’s not straight from the horse's mouth.
- Keep an Eye on the Market: Understanding what your competitors are up to can help you stay one step ahead.
- Innovate: Based on your insights, tweak your products or roll out new features that meet your customers' needs.
- Adjust Your Marketing: Use the insights from product affinity reports to fine-tune your marketing strategies and make your products irresistible.
In a nutshell, using MagicBean to create monthly product performance reports helps you stay on top of your game. It simplifies gathering and visualizing crucial data, so you can quickly see what's working and what needs tweaking. Each report is a chance to understand your market better, refine your strategies, and enhance product offerings.