How to Build a Revenue Report

Ever wondered how well your business is really doing? Imagine having a crystal-clear picture of your company's financial health at your fingertips. That's what a revenue report can do for you! Let's dive right in and discover how you can create this powerful report to track and boost your business growth. Let's dive right in!
What is a Revenue Report?
A revenue report is essentially a financial document that shows the income generated by a company over a specific period. It breaks down where your money is coming from, how much you're making, and which areas of your business are performing the best. Think of it as your business’s report card – it tells you how well you’re doing financially.
How to Calculate Revenue
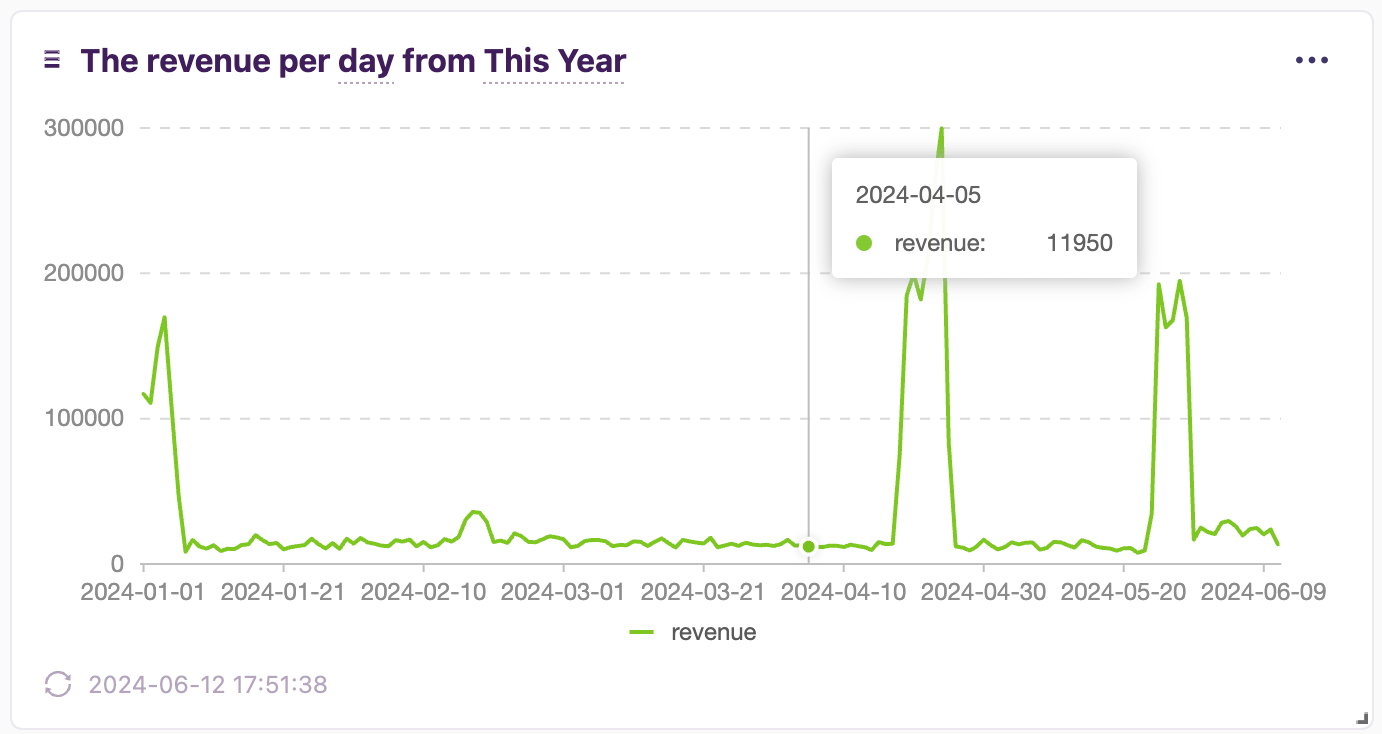
- Daily
- Track your total sales at the end of each day. This helps you understand daily fluctuations and identify peak sales hours.
- Example: If you sold 50 items at an average price of $20, your daily revenue is $1000.

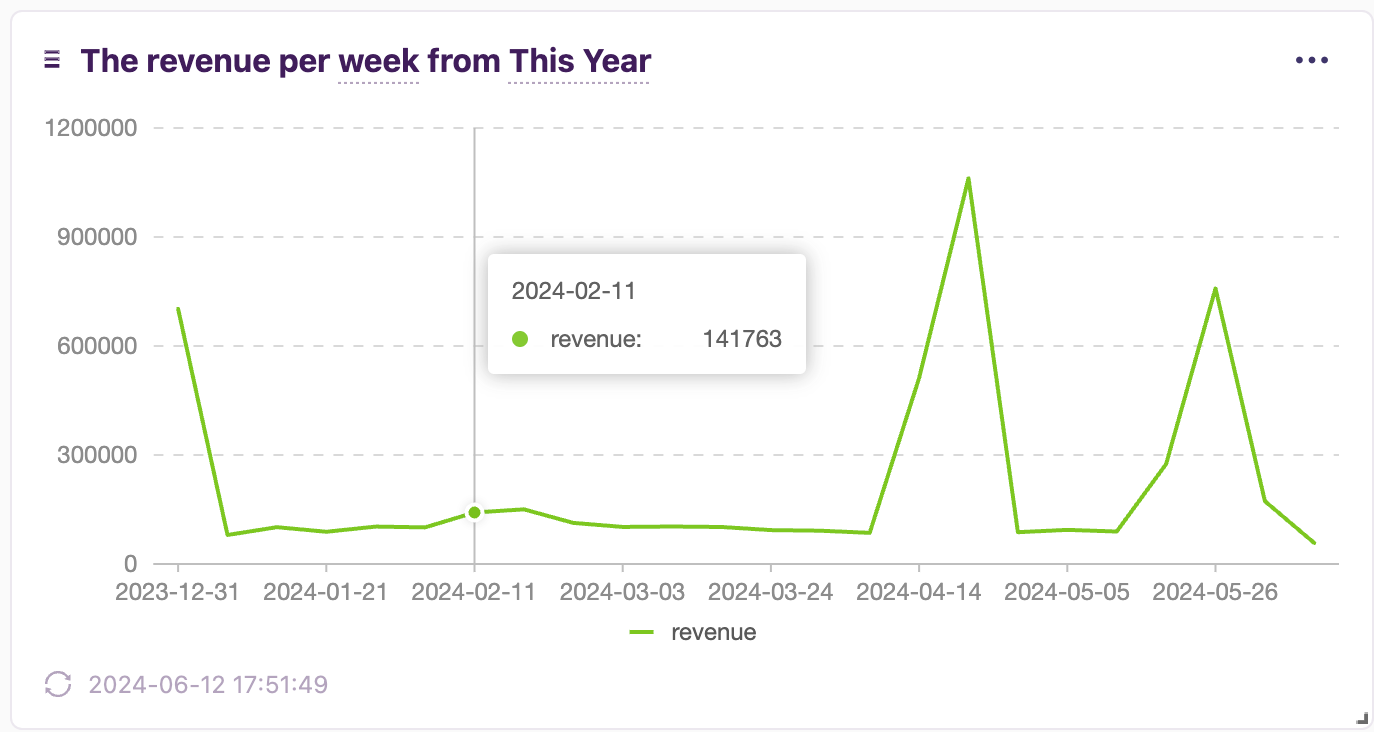
- Weekly
- Sum up your daily revenues for the entire week. This gives you a broader view of your business performance.
- Example: If your daily revenues were $1000, $1200, $900, $1100, $1300, $1000, and $1150, your weekly revenue would be $7650.

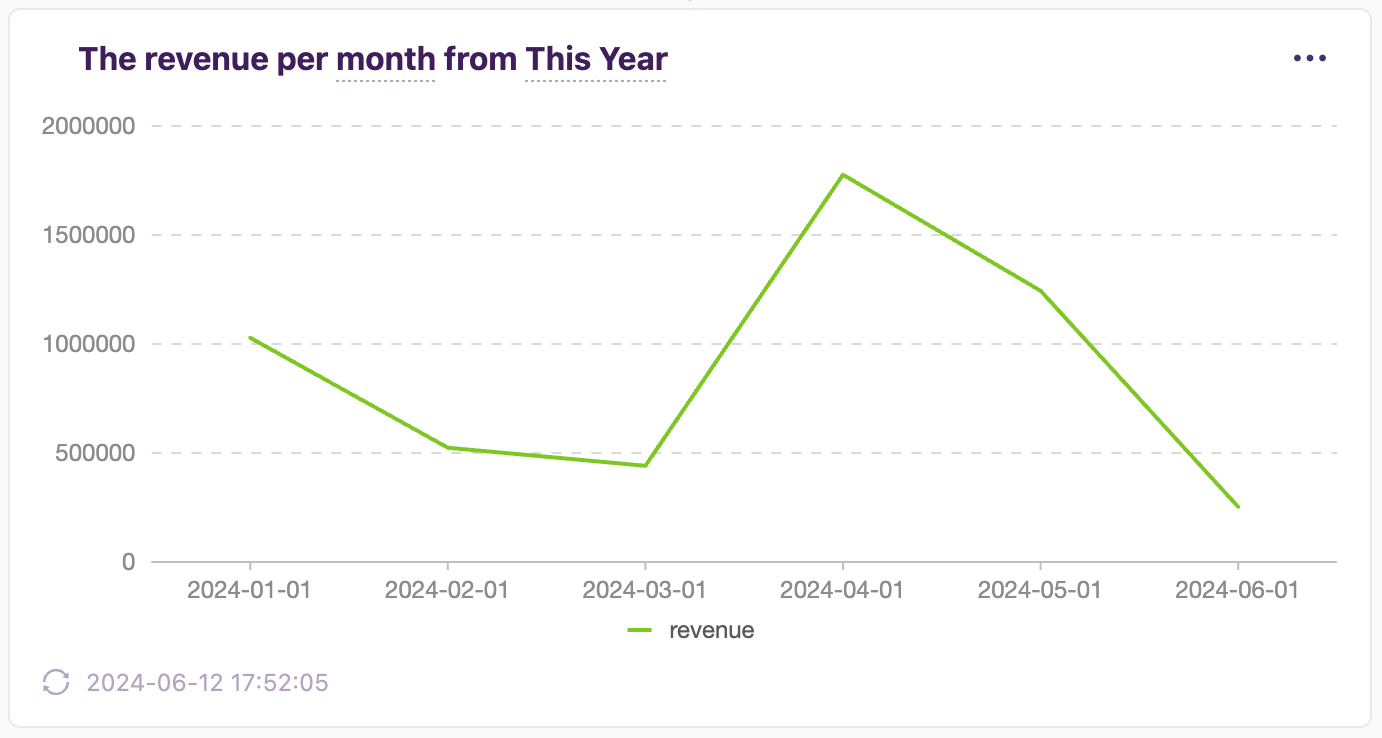
- Monthly
- Add up the weekly revenues for the month. This helps in spotting monthly trends and planning for seasonal variations.
- Example: If your weekly revenues were $7650, $8200, $7900, and $8500, your monthly revenue would be $32250.

- Yearly
- Sum up the revenues for each month to get your annual revenue. This long-term view is crucial for strategic planning.
- Example: If your monthly revenues were $32250, $33500, $34500, and so on, add all 12 months to find your yearly revenue.

Creating a Revenue Report in MagicBean
Now, let's get practical. If you're using MagicBean, creating a revenue report is a breeze. Here’s a step-by-step guide:
- Log into MagicBean
Open MagicBean and log into your account. If you don't have one, you can sign up here. - Navigate to the Reports Section
Go to the 'Reports' section from the home page or dashboard. - Select Report Template
Choose the 'Revenue per day' report template. - Set Your Parameters
Define the period you want to analyze (e.g., last month, last quarter).
Choose the dimensions you want to know (per day, per week, per month, per year). - Generate the Report
Click on 'Submit' to create your revenue report. MagicBean will pull all the data and present it in an easy-to-read format.

Why Your Team Needs a Revenue Report
Revenue reports aren't just for the finance team – they’re essential for everyone in your business. Here's why:
| Reason | Benefits |
|---|---|
| Informed Decision-Making | Provides data-driven insights to guide business strategies. |
| Identifying Trends | Helps spot trends and adjust your approach accordingly. |
| Performance Tracking | Allows you to track the performance of different products, regions, and channels. |
| Resource Allocation | Helps in allocating resources more effectively based on performance data. |
| Motivation and Accountability | Keeps your team motivated and accountable by showing concrete results. |
Creating and maintaining a revenue report might sound like extra work, but it’s an investment in your business’s future. With tools like MagicBean, it’s easier than ever to keep track of your financial health and make informed decisions. So go ahead, dive into your data, and watch your business grow!


